
The Agent Analytics dashboard turns your raw server logs into a handful of clear numbers and charts. This article explains what each KPI counts, how to read it, and what it tells you about how AI engines interact with your site.
If you haven't connected a data source yet, start with What is Agent Analytics? first, the KPIs below only populate once your logs are flowing in.
First, what counts as an "agent visit"?
Every KPI on the dashboard is built on one base unit: the agent visit.
An agent visit is a single request to one of your pages from a recognized AI agent or crawler (identified by its user-agent). Requests from regular human browsers, search-engine crawlers that aren't AI-related, and unrecognized bots are not counted.
A few things worth knowing about how visits are counted:
- Visits are de-duplicated so a burst of near-identical hits doesn't inflate your numbers.
- No personal data is stored. IP addresses are used only to de-duplicate and are stripped before storage, OtterlyAI keeps no Personally Identifiable Information (PII).
- Every KPI respects your filters. The Date range and Engine filters at the top of the view apply to every metric and chart below them.
Overview tab — the headline metrics
At the top of the Overview tab you'll find three at-a-glance numbers.
| KPI | What it counts | Read it as… |
|---|---|---|
| Total agent visits | Every AI-agent request to your site in the selected range | Overall AI attention — is it growing, flat, or spiking? |
| Pages visited | The number of distinct URLs that received at least one agent visit | How much of your site AI engines are actually reaching |
| Top engine | The engine responsible for the most agent visits in the range | Which AI platform is paying you the most attention right now |
Agent visits over time
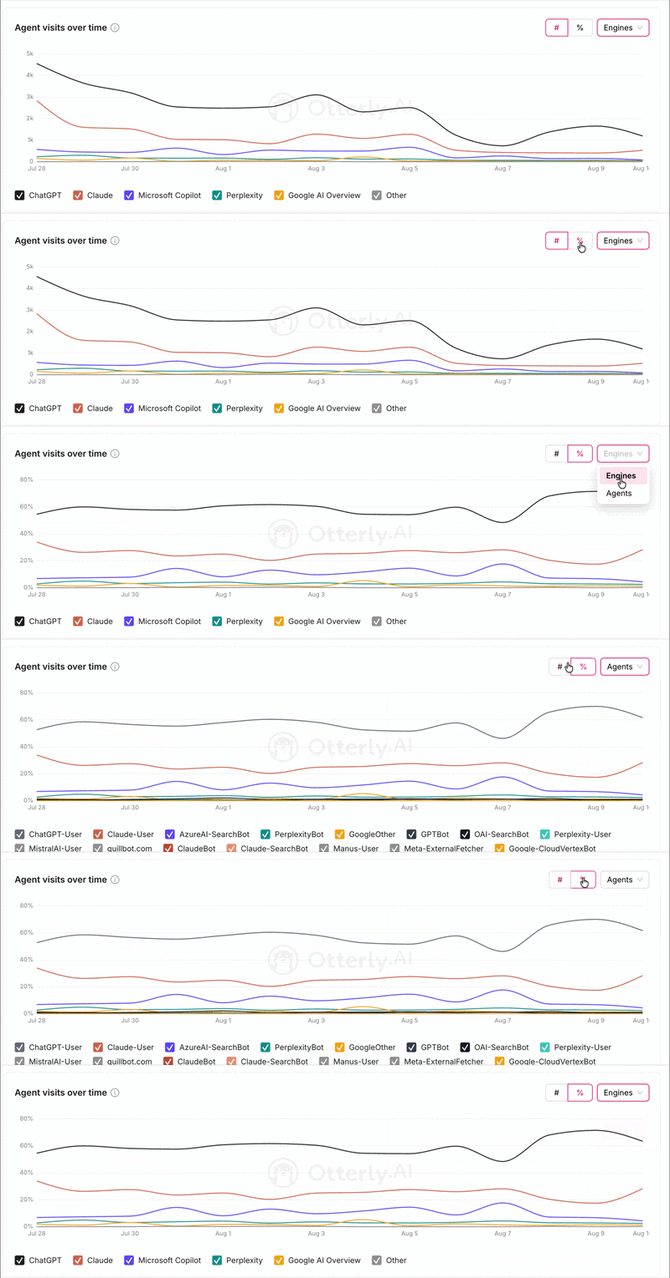
A trend line showing daily visits by AI crawler, so you can see how agent activity changes day to day. Three controls change what the chart tells you:
- Count (#) — absolute number of visits. Best for spotting overall volume, spikes, and growth.
- Share (%) — each line's proportion of total visits.
- Group by — switch the chart between Engines and Agents:
- Engines groups the lines by platform (ChatGPT, Claude, Microsoft Copilot, Perplexity, Google AI Overview, Google Gemini, and Other) — the higher-level view of which platform is visiting.
- Agents breaks it down to the individual crawlers (ChatGPT-User, Claude-User, GPTBot, PerplexityBot, and so on) — the granular view of which specific bot is driving the traffic.
💡 Start on Engines for the big picture, then switch to Agents when a line surprises you and you want to know exactly which crawler is behind it.
Top pages visited by engines
Your most-crawled URLs, each shown with a per-engine color split. This answers two questions at once:
- Which pages are getting the most AI attention.
- Which engine favors each page — the color breakdown shows, for example, that one page is mostly read by ChatGPT while another is dominated by Perplexity.
Use it to confirm that the pages you want AI to read (product pages, docs, cornerstone content) are the ones actually being crawled.
Click See all to open the full Pages tab, where every visited URL is listed.
Agents page visits by types
The top individual agents on your site, each labeled with its category. This is where the KPIs connect to intent: it's not just how many bots visited, but what they came to do — fetch a page for a live user, build a search index, or collect training data.
Click See all to open the full Agents tab, where every agent seen on your site is listed.
For a full explanation of what each category means, see Crawlers & crawler categories.
Pages tab — per-page KPIs
The Pages tab expands "Top pages" into a full, searchable, paginated list of every visited URL, each with its total visit count and per-engine breakdown. Use the search box to check a single URL. You can click on a specific page and see the agents visiting, their category, the trend line and the number of visits.
Read this tab to answer: Which of my pages are AI engines actually reading — and which are being ignored?
Agents tab — per-agent KPIs
The Agents tab lists every agent seen on your site, its category, and its page-visit count. Use the search box to find a specific bot.
Read this tab to answer: Exactly which bots are on my site, and what are they here to do?
A quick reading order
If you're new to the dashboard, scan the KPIs in this order:
- Total agent visits — is AI attention up or down overall?
- Agent visits over time (%) — which engine is driving that change?
- Top pages — is AI reading the right pages?
- Agents by type — is this real user-driven interest, or background crawling?
Related articles