
Agent Analytics shows you every AI agent and crawler that visits your website and which pages each engine reaches. It shows what's happening on your own site: the ChatGPT, Claude, Perplexity, Google, and other bots crawling your pages in real time. It is available on Standard, Premium and Custom plans. For exact events limits on each plan, visit our pricing page.
How to connect your logs?
Agent Analytics works by analyzing your web server logs. To get started, open Agent Analytics click on Connect a data source, choose logs provider and follow the steps for that connector.-Jul-30-2026-03-57-54-7147-PM.png?width=670&height=444&name=Screenshot%20(3)-Jul-30-2026-03-57-54-7147-PM.png)
There are several ways to get your log data into OtterlyAI — pick the one that fits your setup:
| Connector | Best for | Setup effort |
|---|---|---|
| File upload | One-off or historical analysis; no live connection | Low |
| Webhook | Any custom or unsupported provider (CDN, log shipper, proxy, app) | Medium |
| Netlify | Sites hosted on Netlify | Low–Medium |
| Cloudflare | Sites fronted by Cloudflare | Medium–High |
| WordPress plugin | WordPress sites | Low |
If your provider isn't listed, choose Request new integration from the Logs provider dropdown to let us know what you need.
Webhook, Cloudflare, Netlify and Wordpress connectors show only live data after you've connected it. Historical data is available only for log file uploads.
📺 Prefer to watch? This quick walkthrough shows how to connect your logs and start seeing AI agent traffic.
1. File upload
Best for analyzing a specific period, or when you don't want a live connection.
- Select File upload as the provider.
- Choose the Domain the logs belong to.
- Drag & drop or browse for your log file.
Supported formats: .csv, .json, .ndjson, .txt, .log, .gz, .zip
CSV columns (CSV files only - only timestamp and url are required): timestamp, url, host, user_agent, referer, ip
Max 20 files per upload, max 1 GB per file.💡 You can also upload a log file any time from the Upload log file button in the top-right of the Agent Analytics view — handy for topping up a file-based setup with a newer export.
You can find more information about log file upload in this dedicated article.
2. Webhook
Best for any provider we don't natively support — your own system (a CDN, log shipper, reverse proxy, or custom app) POSTs log batches to our endpoint.
Step 1 — Generate your API key. Create it in-app; it has the format oai_live_….
Step 2 — Configure your webhook to send log batches to OtterlyAI:
- Endpoint:
https://analytics.otterly.ai/logs - Header:
Authorization: Bearer oai_live_…
Click Confirm webhook deployment in OtterlyAI.
Step 3 — Send your log events. POST a JSON array of events. Each event uses these fields:
| Field | Required | Notes |
|---|---|---|
requestUrl |
Yes | Absolute URL (scheme + host + path). A relative path is rejected. utm_source is read from the query string. |
userAgent |
Yes | Used to identify the AI agent. |
timestamp |
Yes | Any parseable date/time (RFC 3339 recommended); normalized to UTC. |
clientIp |
No | Used only for de-duplication — never stored. |
referer |
No | Absolute URL. |
Example request:
POST https://analytics.otterly.ai/logs Authorization: Bearer oai_live_… Content-Type: application/json

[ { "requestUrl": "https://example.com/pricing?utm_source=chatgpt.com", "userAgent": "Mozilla/5.0 (compatible; GPTBot/1.1; +https://openai.com/gptbot)",
"timestamp": "2026-06-18T10:28:02Z",
"clientIp": "192.0.2.10",
"referer": "https://www.google.com/" } ]
Batching: send 1–500 events per request, and keep each request body under 256 KB.
Step 4 — Confirm within 24 hours. After sending a test event, click Confirm webhook deployment in OtterlyAI. ⚠️ If you don't confirm within 24 hours, the API key expires and you'll need to generate a new one.
💡 Keep your API key private — treat it like a password. If it's ever exposed, rotate/revoke it in-app.
3. Netlify (via Edge Function)
Best for sites hosted on Netlify. It rides on the generic webhook (#2): a small Netlify Edge Function runs on every request and streams matching AI-agent hits to the same /logs ingest endpoint — nothing for the customer to host or run.
Setup
- Download otterlyai-agent-log.ts and copy it into your site's
netlify/edge-functions/directory. - In OtterlyAI, set up a Generic webhook integration (see #2) and copy the API key (
oai_live_…). - In Netlify → Site configuration → Environment variables, add
OTTERLYAI_API_KEYand set it to that key. - Deploy the site.
Data should start appearing in the dashboard within a few minutes.
Debugging. If nothing shows up, check the function output under Netlify → Logs → Edge Functions. Verify OTTERLYAI_API_KEY is set for the deployed context and that the visiting user-agent matched a known AI agent.
4. Cloudflare
Best for sites served through Cloudflare.
This flow is more involved than the webhook: OtterlyAI uses your Cloudflare API token to deploy a small Worker and route into your account, which forwards only AI-bot traffic to OtterlyAI. Your normal site traffic is untouched, and if forwarding ever fails it never affects your site.
Step 1 — Create a Cloudflare API token.
In Cloudflare, go to My Profile → API Tokens → Create Token and use the built-in "Edit Cloudflare Workers" template — it grants everything needed. When setting the token's scope:
- Account resources: include the account that owns your zone.
- Zone resources: include the specific zone(s) you want to connect (or All zones).
The token is used once, at deploy time, and is never stored by OtterlyAI.
Step 2 — Connect in OtterlyAI:
- Select Cloudflare as the provider.
- Paste your Cloudflare API token.
- Click List zones and pick the zone you want to track.
- Click Deploy.
OtterlyAI deploys to your selected zone, and AI-agent traffic will start appearing in your Agent Analytics view.
Step 3 — (Optional) Keep your Worker under Cloudflare's daily limit
Cloudflare's free Workers plan allows 100,000 requests per day. By default the Worker runs on every request to your site, including static files like CSS, JavaScript, images, and fonts, which can use up that allowance quickly.
Since AI-crawler tracking only needs your actual page views, you can stop the Worker from running on asset files. In Cloudflare, a route set to Worker = None is skipped and doesn't count toward the 100k/day limit, so your pages keep getting tracked while your assets are ignored.
To set this up, keep your existing yourdomain.com/* route pointed at the OtterlyAI Worker. Then go to your domain → Workers Routes → Add route, and add each asset folder below with Worker = None:
WordPress sites (if applicable):
yourdomain.com/wp-content/*

yourdomain.com/wp-includes/*
Other common asset folders (add any that applies to the site), example:
yourdomain.com/assets/*yourdomain.com/static/*
yourdomain.com/uploads/*
yourdomain.com/media/*
yourdomain.com/fonts/*
Each route must end with *, the host may start with *, and you can't put * in the middle or add a query string.
Removing the Cloudflare connector later
Disabling or deleting the connector in OtterlyAI stops data collection immediately. To also remove the deployed components from your Cloudflare account:
- Cloudflare dashboard → Workers & Pages → delete the
otterly-agent-<zoneId>Worker. - In the zone's Workers Routes, delete the route pointing at that Worker.
Webflow site? Set it up with Cloudflare's officially supported "Orange-to-Orange" method - [full walkthrough here →].
5. WordPress plugin
The simplest option for WordPress sites — nothing to configure after install.
- Select WordPress as the provider.
- Click Download Plugin to get the pre-configured OtterlyAI logger plugin and copy the API key.
- In WordPress, upload and install the plugin, then activate it.
- Set your API-Key in the Wordpress Plugin via the Settings.
Once activated, the plugin automatically streams access logs to OtterlyAI Agent Analytics.
Where your connected sources live: Data sources
All your connected log sources live in one place: the Data sources section (under General in the left sidebar). From here you can see every domain you've connected, its type, provider, associated brand report, and when it was added, and add a new one with + New data source.
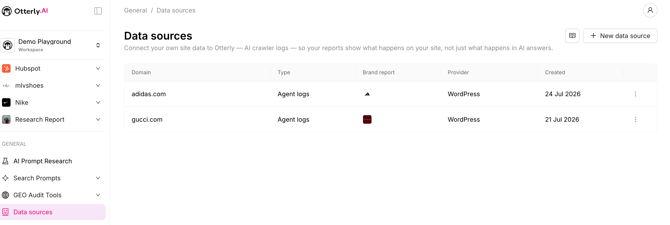
Two things worth knowing about how data sources behave:
- Data sources are unique per workspace. Each workspace manages its own connections; sources connected in one workspace aren't shared with another.
- A connected domain feeds every brand report that uses it, automatically. If two brand reports in the same workspace track the same domain (for example, two reports for the same brand), both show that domain's agent data without you connecting it twice.
Using Agent Analytics
Once your logs are connected, open Agent Analytics.
Global controls:
- Date range filter (e.g. Last 14 days)
- Engine filter (All Engines, a single engine, or multiple engines of your choice)
- Data sources gear in the top-right (where you'll be able to delete the connection/re-upload a log file)
The view is split into three tabs: Overview, Pages, and Agents.
Overview tab
Your at-a-glance summary of AI agent activity.
- Headline metrics: Total agent visits, Pages visited, and Top engine.
- Agent visits over time — a per-engine trend line. Toggle between absolute count (#) and share (%), and group by engine. Covers ChatGPT, Claude, Microsoft Copilot, Perplexity, Google AI Overview, Google Gemini, and Other.
- Top pages visited by engines — your most-crawled URLs, each with a per-engine color split so you can see which engine favors which page.
- Agents page visits by types — the top agents, labeled with their category.
-Jul-30-2026-03-54-33-1642-PM.png?width=670&height=363&name=Screenshot%20(2)-Jul-30-2026-03-54-33-1642-PM.png)
Pages tab
A full, searchable, paginated list of every visited URL, with total visits and a per-engine color breakdown. Use the search-by-page box to jump to a specific URL.
Use this tab to answer: Which of my pages are AI engines actually reading — and which are being ignored?
Agents tab
A full, searchable, paginated list of every agent, its category, and its page-visit count. Use the search-by-agent box to find a specific bot.
Use this tab to answer: Exactly which bots are on my site, and what are they here to do?
Understanding agent categories
Not every AI agent visits for the same reason. OtterlyAI groups them into three categories so you can tell real-time user-driven fetches apart from background crawling:
| Category | What it means | Example agents |
|---|---|---|
| On-Demand AI Fetcher | Fetches a page in real time in response to a user's prompt | ChatGPT-User, Claude-User, Perplexity-User, Gemini-Deep-Research, MistralAI-User, Manus-User, Meta-ExternalFetcher |
| Search Index | Crawls to build or refresh a search index | AzureAI-SearchBot, PerplexityBot, OAI-SearchBot, Amzn-SearchBot |
| AI Training / Data Scraper | Crawls to collect training data | GPTBot, GoogleOther, ClaudeBot |
💡 Why the categories matter: On-Demand Fetchers are the most directly tied to visibility — they mean a real user just asked an AI something and it came to your page to answer.
How Agent Analytics fits with the rest of OtterlyAI
- Brand Reports show how you appear inside AI answers (mentions, citations, position).
- GEO Audit checks whether AI crawlers can access your site.
- Agent Analytics shows which crawlers and agents actually do visit — closing the loop between "can they reach me" and "do they cite me."
Together they answer: can AI read my site → does it visit → does that turn into a citation.
Agent Analytics inside your Citations report
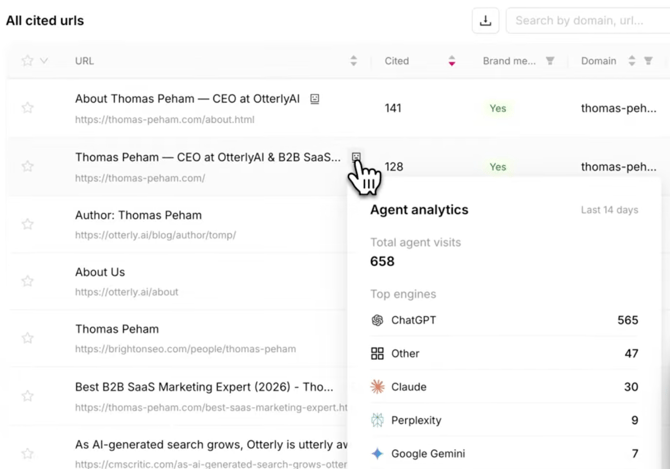
Once you've connected a data source, Agent Analytics data flows straight into your Brand Report's Citations view. In the All cited URLs table, any URL whose domain you've connected shows a small Agent Analytics widget icon next to it, a quick way to tell, without leaving the citations table, whether AI agents actually visited the page that's being cited.
Hover over the icon to open the Agent analytics popover for that specific URL. It shows:
- Total agent visits — how many times AI agents and crawlers hit that exact URL.
- Top engines — the per-engine breakdown of those visits, each with its own visit count.
Where is the data stored of Agent Analytics?
For the Agent Analytics data, we are no data processor in the sense of GDPR, as we do not store any Personal Identifiable Information (PII). IP addresses will be removed from the data before they are stored in our data storages.
Related articles