What is the OtterlyAI Data (Looker) Studio Connector?
The OtterlyAI Data Studio (formerly Looker Studio) connector lets you pull your AI search visibility data directly into Google Data Studio. Build custom dashboards, create automated reports, and share AI search performance data with your team or clients, all using the same data you see in OtterlyAI.
Why use it
- Live data from all major AI engines — pull metrics from ChatGPT, Perplexity, Google AI Overviews, and more directly into your reports.
- Fully custom visualizations — build charts and layouts that match how your team prefers to see data.
- Easy sharing — share interactive dashboards with stakeholders who don't need an OtterlyAI login.
Before you start
You'll need an active OtterlyAI account with at least one workspace, plus a Google account with access to Data (Looker) Studio. The Google Data Studio Connector is available for Standard, Premium or Custom Enterprise Plans of OtterlyAI.
Setup
Here's a quick video on setting up the Data (Looker) Studio Connector with your OtterlyAI account.
Step 1: Access the connector
Head over to your Profile Settings > Integrations. Open the OtterlyAI Data (Looker) Studio connector. Make sure you're signed into your Google account.
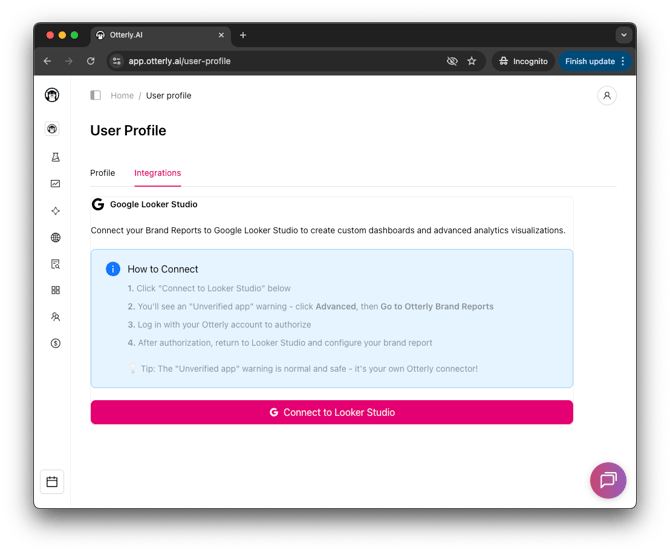
Step 2: Authorize the connection
Make sure you are logged in to your Google Data (Looker) Studio account. You can also create a free account here.
Click "Connect to Data (Looker) Studio" in the OtterlyAI integrations tab.
Step 3: Configure your data source
Select which OtterlyAI workspace and Brand Report you want to connect. Additionally, you can select a particular AI engine, Country or a Tag.

Step 4: Connect
Click Connect. The connector will validate your setup and show you the available fields. You do not need to adjust the available fields here. Click Create Report to start with the first Data (Looker) Studio report.
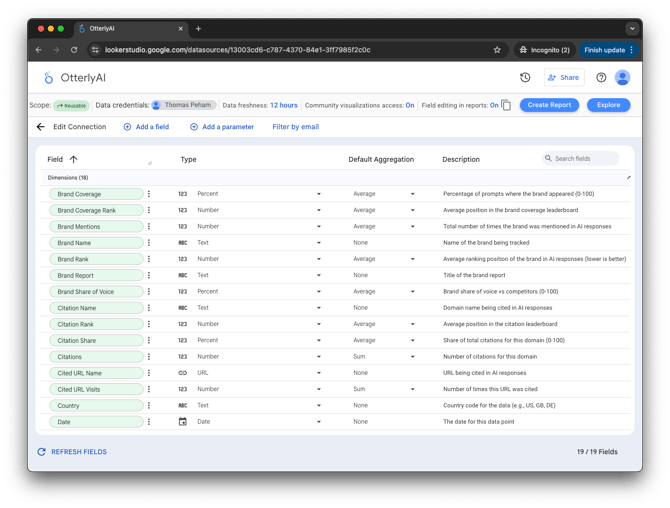
Available fields
| Name | Type | Description | Example |
|---|---|---|---|
| Filter Dimensions | |||
| Date | Date (YYYY-MM-DD) | The date for this data point | 2024-01-15 |
| Brand Report | Text | Title of the brand report | Q1 Tech Brands |
| Brand Metrics | |||
| Brand Name | Text | Name of the brand being tracked | Nike |
| Brand Coverage | Percent | Percentage of prompts where the brand appeared | 45% |
| Brand Mentions | Number | Total times the brand was mentioned in AI responses | 127 |
| Brand Mentions (Total) | Number | Total number of brand mentions (sum over period) | |
| Brand Share of Voice | Percent | Brand share of voice vs competitors | 32% |
| Brand Rank (Daily) | Number | Average ranking position in AI responses (lower is better) | 2.3 |
| Brand Rank (Period) | Number | Period brand rank — matches dashboard Average brand position. Chart date range must match data source. | 1.8 |
| Brand Coverage Rank (Daily) | Number | Average position in the brand coverage leaderboard | 1 |
| Brand Coverage Rank (Period) | Number | Average period rank in the brand coverage leaderboard. Chart date range must match data source. | 1 |
| Brand Sentiment NSS | Number | Net Sentiment Score (-100 to +100, higher is more positive) | 42 |
| Sentiment Negative | Number | Count of negative sentiment mentions | 14 |
| Sentiment Neutral | Number | Count of neutral sentiment mentions | 38 |
| Sentiment Positive | Number | Count of positive sentiment mentions | 75 |
| Domain Metrics | |||
| Domain Name | Text | Domain associated with the brand | nike.com |
| Domain Coverage | Percent | Percentage of prompts where the domain was cited | 28% |
| Domain Rank (Daily) | Number | Average ranking position of the domain (lower is better) | 3.5 |
| Domain Rank (Period) | Number | Period rank of the main domain in the citation leaderboard. Chart date range must match data source. | 4 |
| Citation Metrics | |||
| Citation Name | Text | Domain name being cited in AI responses | wikipedia.org |
| Citations | Number | Number of citations for this domain | 89 |
| Citation Share | Percent | Share of total citations for this domain | 15% |
| Citation Rank | Number | Position in the citation leaderboard | 2 |
| URL Metrics | |||
| Cited URL Name | URL | URL being cited in AI responses | https://example.com/article |
| Cited URL Visits | Number | Number of times this URL was cited | 34 |
Creating your first report
After connecting, click Create Report. Data (Looker) Studio opens the editor with your OtterlyAI data ready to use. From there you can add charts, tables, and date range controls from the toolbar. For a full overview of visualization options, see Google's chart types documentation.
You have two options for working with OtterlyAI data in Looker Studio:
- Build from scratch — design your own visualizations and layouts from a blank report.
- Add to an existing report — connect OtterlyAI as a data source alongside your other marketing data (e.g. Google Analytics, Search Console).
For a quick start, OtterlyAI includes a pre-built report template that loads automatically when you click Create Report after connecting.

Troubleshooting
Authorization failed — Make sure you're using the correct Google account. Clear your browser cache and try again.
No data appears — Verify you selected the correct workspace and that your date range includes dates with tracked data. Loosen any filters you've applied.
Data loading slowly — Reduce your date range or remove unnecessary filters. Large datasets take longer to load.
Wrong workspace data — Double-check your workspace selection in the data source settings and confirm you have the correct access permissions in OtterlyAI.
Shared data source affects multiple reports — If edits to one report change others, the reports are sharing the same data source. To fix this:
- Go to Resource > Manage added data sources and verify if the source is shared.
- Add the Otterly connector again and create a new data source per report or client.
- Configure each with the correct workspace.
- Remove the old shared source from the affected reports.
Comparing and Combining Data
Creating a tag comparison report
You can compare two or more OtterlyAI tags side-by-side in a single Looker Studio report:
- Go to Resource > Manage added data sources and add the OtterlyAI connector twice, connecting each instance to a different tag. Name them clearly (e.g. Tag 1, Tag 2).
- Assign each widget to the correct data source in the right-hand Data panel.
- Label widgets clearly so you can distinguish between datasets at a glance.
Tips:
- Use consistent layouts — for example, place Tag 1 widgets on the left and Tag 2 on the right for easy comparison.
- Apply the same date range filters to both data sources for accurate results.
- Consider using a blended data source if you need both tags in a single chart.
You can apply the same approach to compare different AI engines — just connect each engine as a separate data source and follow the same steps. The same goes for Countries.
Need help?
Email support@otterly.ai with a description of the issue and screenshots if relevant.